
Productive Edge (P/E) applies the most advanced digital technologies to create unique experiences. Whether it’s automating a complicated manual system or leveraging technology to make connected devices talk to each other, we are gathering enormous amounts of data that can be leveraged for valuable insights.
By using advanced analytical techniques, PE is often able to discover important relationships that might otherwise go unnoticed. One powerful technique is to use data visualizations to “see” the data. This blog series presents best practices on how to approach creating data visualizations and provides examples of how Productive Edge has leveraged them to help our clients achieve their business objectives.
Data Visualization and AI
People often assume that Artificial Intelligence (AI) can be simply plugged in to provide immediate, actionable results. But the size, scope, or budget of a project can impede the viability of using AI. Therefore, in many modern computer systems, human intelligence remains a critical component of the workflow.
Surprisingly, the underlying intelligence of many systems remains hidden behind lines of code or database queries, and many don’t have any kind of monitoring systems built-in. This is the equivalent of driving a car with no dashboard. The car goes from point A to point B, but you don’t know its speed or how much gas you have left.
A stepping stone to AI is leveraging all this new technology and data in ways that we as humans can understand. With Digital Visualization tools, we can creatively roll-up data and statistics into graphs, maps, pie charts, or even just plain old numbers. This data roll-up can provide insights into processes or help us create dashboards that let us monitor many tasks in a single place.
The more we can understand the data and visualize it, the better we can work with it. Building the relationship between systems and human creativity can unleash intelligence and pattern recognition like never before.
The Business Process
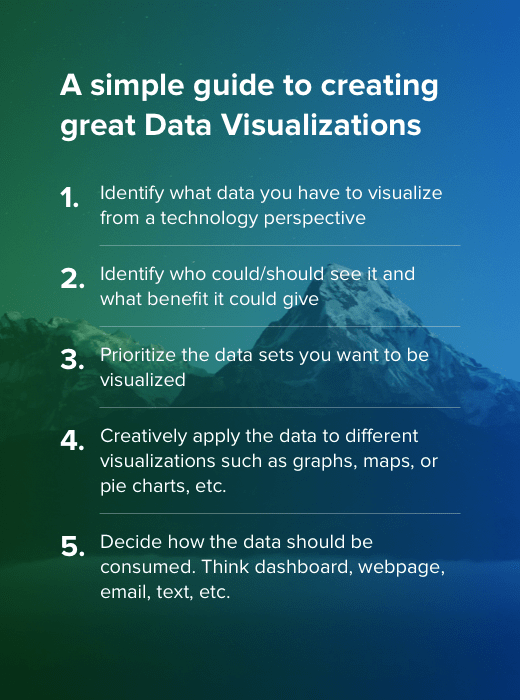
One important aspect of creating great Data Visualizations is understanding the system or process you are working on from the viewpoint of the project stakeholder, whether they are a development team, the executive leadership, an actuarial team, the end customers on a website, or any other constituency. You must identify the types of information that would be most helpful to your target audience and prioritize it accordingly.
.jpg?width=300&name=shutterstock_789657727%20(1).jpg) Next, you have to decide if the respective data is better visualized as a graph, a number, or another visual representation or infographic. What range provides the most value? How complex should the visualization system be? Can it logically be represented as a map? This is where the creativity comes in. The human mind craves the simplest solution, so visualizations must be easy to understand and to digest.
Next, you have to decide if the respective data is better visualized as a graph, a number, or another visual representation or infographic. What range provides the most value? How complex should the visualization system be? Can it logically be represented as a map? This is where the creativity comes in. The human mind craves the simplest solution, so visualizations must be easy to understand and to digest.
Productive Edge has expert UX Designers and Product Owners that can help create and workshop creative data visualizations. It’s not just about gathering and presenting the data, but also making it visually accessible, intuitive, and insightful.
During the software development cycle, it’s possible to identify what would make great data visualizations. A few ways we do that include:
- Discovery - When defining the scope and cost of a project, we can assess and identify beneficial reporting that will enhance the system and be helpful to users.
- System Architecture - When designing the technical solution, we strive to identify upfront what data will be available to provide insights into what we can visualize.
- Stakeholder Interviews - We identify metrics and KPIs that project stakeholders would like to see.
- User/Customer Interviews - Customers identify gaps in what they see and what is most important to them.
- Version 2.0 - When we create the next version of an existing system, we fix known issues, and identify areas to improve.
Want to learn more? Read Part 2 of this blog series.